2 minutes
Worldcloud figure in R
The following example presents a simple function to evaluate a chunk of text and present it in a fancy way: displaying a wordcloud.
The selected text is taken from the Bertrand Russell’s Nobel Prize Acceptance Speech
What Desires Are Politically Important?, 11th of December of 1950
The libraries used in this example are: wordcloud1, tm2, colortools3
    library(wordcloud)  # to analyse and plot text
    library(tm)         # a text mining package
    library(colortools) # to make colour functions
After loading the file, the function Corpus is applied to convert the plain text file to a
natural language one, adding a metadata related to the existing words.
    speech = readLines("myData/BR.txt")
    myCorpus = Corpus(VectorSource(speech))
Then, a minimal mining process is performed in order to remove punctuation, numbers, symbols and common connectors.
    myCorpus <- tm_map(myCorpus, removePunctuation)
    myCorpus <- tm_map(myCorpus, removeNumbers)
    myCorpus <- tm_map(myCorpus, function(x)removeWords(x,stopwords("english")))
And finally, the text is summarised as a table of frequencies.
    tdm <- TermDocumentMatrix(myCorpus)
    m <- as.matrix(tdm)
    v <- sort(rowSums(m),decreasing=TRUE)
    d <- data.frame(word = names(v),freq=v)
Employing such a dataset, a graph can be generated using default parameters.
wordcloud(d$word,d$freq,c(8,.3),2)
And as an illustrative example, the graph can be customized with extra parameters (..not the best plot though)
wordcloud(d$word, d$freq, c(4, 0.5), 1, 300, TRUE, FALSE, .15, pal, vfont=c("gothic english","plain"))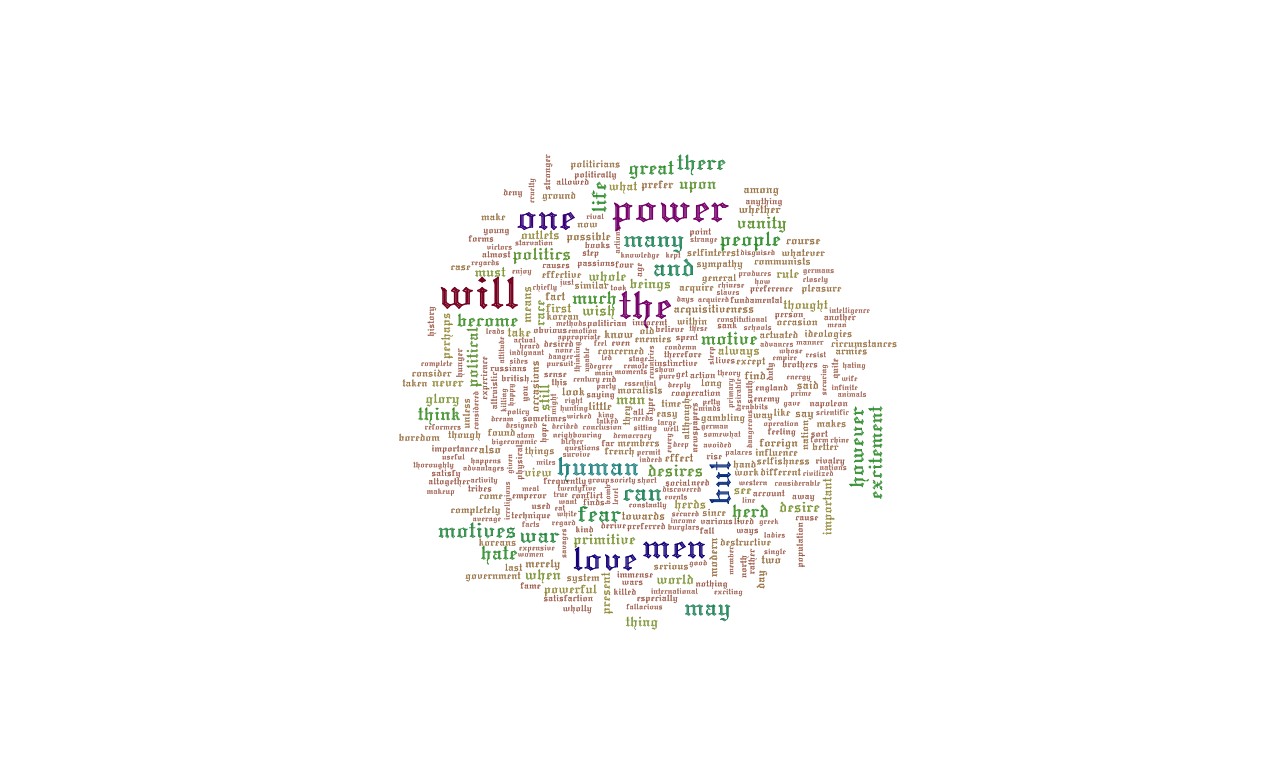
NOTE: May I suggest an exercise? Try the function with a random ‘holy’ text such as xxxxxxx, words don’t lie. You may find too much controversial words for a bunch of sacred texts.
I hope this has been useful.
[- Download Speech]
- Ian Fellows (2014). wordcloud: Word Clouds. R package version 2.5. https://CRAN.R-project.org/package=wordcloud [return]
- Ingo Feinerer and Kurt Hornik (2015). tm: Text Mining Package. R package version 0.6-2. https://CRAN.R-project.org/package=tm [return]
- Gaston Sanchez (2013). colortools: Tools for colors in a Hue-Saturation-Value (HSV) color model. R package version 0.1.5. https://CRAN.R-project.org/package=colortools [return]